VIDEO
Carly Richmond (Developer Advocate at Elastic) discuss the reasons why feedback on feature adoption can be difficult to validate. Measure feature effectiveness quantitatively to support qualitative user feedback.
Like what you see here? Our mission-aligned Girl Geek X partners are hiring!
- Check out open jobs at our trusted partner companies.
- Watch all ELEVATE 2023 conference video replays!
- Does your company want to sponsor a Girl Geek Dinner? Talk to us!
Sukrutha Bhadouria: Hi, I hope everyone’s having a wonderful time in the conference. Up next we have Carly. Carly is a developer advocate at Elastic. Prior to Elastic, she spent over a decade working as a technologist at the large investment bank specializing in front-end web development and agility. She’s an agile evangelist, UI enthusiast and regular blogger. Welcome, Carly.
Carly Richmond: Thank you. Thanks for having me and lovely to see everyone. Hi. Today I’m going to talk about a problem that I’ve actually seen for a proportion of my career when I worked in an investment bank. And the main problem I’m going to talk about is regarding adoption of features and user experience. Trying to determine, this is something that I’ve always really struggled with as a front-end developer, yet it’s something that’s critical to my understanding of, you know, how I can build better software.
Carly Richmond: And today that’s exactly what I’m gonna talk about. I’m going to talk about why it’s a hard problem to solve, how we can do this in a more quantitative way and how we can use tools such as Google Lighthouse, Synthetic Monitoring, and Elastic Real User Monitoring to achieve that. Okay, so as I said, I used to work at the bank and within that time I used to work in a mixture of waterfall, scrum and kanban paradigms depending on the team, which meant that we did a lot of reviews with our users talking about features.
Carly Richmond: I found to extend the analogy, reviews were really similar to giving gifts at Christmas or birthdays. And normally you’d have one or two particular scenarios working. Either I would, they would immediately open up, see the new features and they would think it was great, you know, they wouldn’t stop talking about it. They would be super excited. Most likely, I would come away from those sessions with a list of, you know, so many other items to add to the backlog. It was great and you knew straight away from that that things were great and that this feature was most likely going to be adopted. And then sometimes you got something that I would mark akin to that moment when you get that awkward Christmas jumper from that looks a bit itchy and uncomfortable and not quite your style, where you get a kind of smile and a nod and you don’t really get any information at all.
Carly Richmond: And particularly if you’re working with people that you know very well, you work within the same company, it can be really difficult and awkward sometimes to get that negative feedback. And the reality is that’s a problem because do you know when we find out about it, when the panic station hits, when red alert starts going off and you’re running as a developer to your console, to an escalation, searching through logs and panicking and trying to figure out what’s going on. And normally when you know the lights turn back to normal again the panic is over. It was always these points where I thought, could I have caught this earlier? Was there other means in which I could have got better feedback earlier? So I’m gonna tell you a little story and it was basically one of the main turning points for me where it made me realize I need to do something else about this.
Carly Richmond: Once upon a time in a very large investment bank, a group of eager developers had been busily building new features for months, regularly showing the features to users and had a very happy sponsor at the end of it. Yet a few months later we’re getting a phone call in a panic saying, you know, the screens are slow, we don’t know what’s going on. The analysts don’t wanna use this, you need to fix this right now. We’re diving through the server logs, everything seems to be ticking fine, but it’s all based on the front end that something is wrong. And I had a colleague come to the rescue, he pulls up Chrome developer tools and we start looking through the profiling. So using the flame graph to see what’s going on. But we also started using a tool called Google Lighthouse, which you can see on the screenshot in front of you.
Carly Richmond: And this was the first time that I got to see some example metrics that I thought I could use to determine web performance and the user experience in my applications. And these metrics are called Core Web Vitals. They were initially announced by Google in May of 2020. And there are a series of measures that are used to evaluate the user experience of websites. For anyone who’s looking more from a search engine optimization perspective, you might have heard of these two. And the reason for that is that they were included as part of the course search ranking criteria in Google as of June 2021.
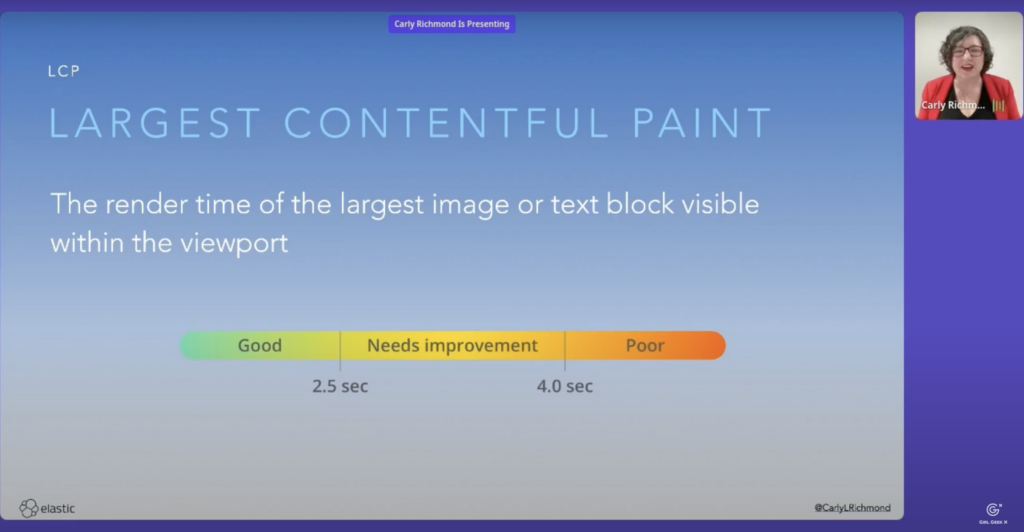
Carly Richmond: There’s three primary measures that we’re gonna talk about today that are the main part of the suite and the first of which is called Largest Contenful Paint. LCP is basically an indication of that initial response time, time. When a user is navigating to your site, are they actually going to be able to see something or is there a potential that they might think your site is unavailable and maybe end up going somewhere else perhaps to a competitor?
Carly Richmond: Ideally, we’re talking about a measure of on 0.2 0.5 seconds and the render time that I’m talking about here is about the largest image or text block that’s visible within the view port. As I said, that initial experience for a user, the second measure we often talk about with Core Web Vitals is what’s called First Input Delay. Now it is about user responsiveness. It is the time for when a user inputs an action such as a click and when that corresponding command is executed. And ideally you want this to be under a hundred milliseconds, we’ve all been there in that situation where we think our site is not responded to click and we start mashing again on the mouse or on the keyboard. And the hundreds milliseconds is run about the threshold when you start thinking something’s not quite right.
Carly Richmond: And then the final measure, which I consider the the most complicated in the one that maybe we don’t initially think is important, but it really is, is Cumulative Layout Shift. It might seem a bit strange that we’re talking about movements and layouts and webpages, but the fact of the matter is that if you have a page that is moving around a lot and is unstable, that means there’s more of a chance for user error.
Carly Richmond: We’ve all been in that situation where another option pops up above the one we want and we end up inadvertently hitting the wrong thing. Your C ls is calculated from all of the shift scores across the entire lifetime of the page. All the ratios of movement are calculated and then the largest burst is your CLS for the page. And that should ideally be under not 0.1. We can calculate these using Google Lighthouse either within Chrome developer tools as I showed before, or also we can do smart things like including them using plugins in our continuous integration pipelines or even running them ad hoc as reports on the command line.
Carly Richmond: It’s a great point to do this at different stages in your development cycle, but one of the problems I’ve found is normally I’m using Google Lighthouse when it’s too late cuz I’ve already detected with my spidey sense that something is wrong. And while this gives us the Core Web Vitals and the opportunity to evaluate the user experience, it doesn’t address the question of are our users indeed using it so we know we need something else. And we know as well that potentially if we’re doing the recording function for this, that we’re going to be making assumptions of what the user workflow is and we’re capturing metrics on that rather than what they’re actually doing.
Carly Richmond: One way that I’ve seen people try to rectify this cuz they don’t really wanna spy on their users and monitor them is we use Synthetic Monitoring. I’m sadly not talking about having my lovely workmate paper here sitting with you actively running the workflow against your website.
Carly Richmond: I’m talking about the use of scripts and workflows to basically stimulate the behavior a user might engage in. And you can do this in one of two ways. You can either trigger regularly an endpoint such as an http service every 10 minutes or so or whatever your frequency is that you desire and see that it’s still alive. Or you can make use of more sophisticated things such as browser monitors, which normally use scripting technologies such as playwright, which I’ve got here in order to emulate the user workflow. Similar to end-to-end testing if anyone’s done anything like that and be able to basically see every 10 minutes if that workflow is running as expected, is it perhaps starting to lag and slow down, in which case there might be a degradation of performance to look at or even if particular steps are failing.
Carly Richmond: Synthetic monitoring is a great way to try and look at the performance of a website. However, it still doesn’t answer that question of are they really using it? So we need something else to compliment these technologies and it’s time to crack out the rum. Now I am not talking about favorite alcoholic beverage pilots, sorry I know it’s early in the morning for everybody, but what I’m talking about is Real User Monitoring and this is a mechanism for collecting navigation information errors and other metrics based on the real user behavior against a website.
Carly Richmond: You might have heard of OpenTelemetry, which in observability circles is the open standard for an open protocol for capturing traces. Sadly, there is not a realm equivalent at this time. There’s a great proposal. Anyone who’s interested to go check out the the GitHub, however, what you can use is view user monitoring agents for whichever observability platform you are using. The way they work is that they’ll run alongside your JavaScript application. I’ll show you how to instrument the agent in a moment. And then in the case of Elastic, although other observability providers will do something similar, all of the traces and metric information will be sent to the integration server.,APM Integration, which will persist the data down into an elastic search index. And then you’ll be able to see the particular traffic messages either via the apps within Kinbana that are dedicated to observability, case in point, user experience dashboard, or also within Kinbana Discover where you can build your own dashboards too.
Carly Richmond: I promised you some instrumentation, I have some code here I’ll walk through briefly. But if you wanna dig into this or examples on instrumenting backend services with APM, I’ve got a handy link at the bottom in the QR code. Go to the GitHub, have a look at the code and please do contact me with any questions or if you wanna chat through any thoughts. it’s a case of using the Elastic APM RUM dependency installed via your favorite package manager. So MPM or yarn. And then what you’ll do is you’ll run the initialized command passing in the name you want to give your service known as the service name. You’ll pass in for any cross origin requests, the URLs that you’re going to be sending them to, cuz by default, although it enables distributed tracing, it’s only done on a single origin with the agent unless you specify that option, you specify your Elastic cluster and then you have optional attributes such as the environment and service version.
Carly Richmond: If you want to get into more detailed view and compare changes over time, you might be wondering if you’re using particular JavaScript frameworks well does that change anything only slightly? You might need to make use of an integration to take advantage of custom error handling or routing that is given on top of these frameworks. And the example I’ve got in here makes use of APM RUM react, which is the additional MPM dependency or yarn dependency you’d need to install. And you can see I’m using that route in place of my traditional reactors or route which will capture the navigations for me. Simples, if you want to dig in, please check out the GitHub. The codes at the bottom corner or if you ping me afterwards I can send it to. So I now have information I really wish I’d had at the time when I was a front end developer.
Carly Richmond: If I could hop back in my door and travel back in time just like Marty from back to the Future, I would be taking rum with me and trying to use it to solve some problems that I had in my time as a front end engineer. I’m going to talk through some stories in the remaining time and show how I would use RUM to solve these problems. Let’s go back to that performance story that proved to be the kinda wake up call for me and one of the issues I highlighted was that we weren’t sure where the problem was.
Carly Richmond: We were diving through into the server logs as well as looking at the front end to try and identify the issue. Being able to have Core Web Vitals was one of the things that proved to be a turning point. But rather than having to calculate it using Google Lighthouse and a custom instrumentation, if you make use of RUM, the dashboard will actually calculate what these vitals are based on the real user traffic, which can be a great time saver if you are running about an emergency trying to fix something urgently.
Carly Richmond: But because it’s also capturing the real user behavior, it also gives you traces which anyone from an observability background might be familiar with views such as this. What you’ll see here is I’ve got two services being captured. I have in green the front end which basically has, it shows you the key execution time for loading of my JavaScript files for triggering the calls on that side. And then you can see the subsection in blue, which is my back end node JS server. And then fat the majority of the time is taken up with front end transactions in this case, which can be a useful thing for identifying bottle mix.
Carly Richmond: The second challenge I sometimes came across was that I would get conflicting accounts from users. Now I was in a privileged position, all my users sat a couple of floors down for me when I worked on one particular team and I could just hop down and ask them what they thought about things in addition to trying to get feedback in those reviews I talked about.
Carly Richmond: But one of the things that was interesting was I would get different answers depending on who I spoke to. So some users were really early adopters and would use features very quickly and straight away. Some might have used it once or twice but then fell back to their own process and then some might not have heard about it, maybe they were on holiday or out sick when that review happens and that information hadn’t maybe permeated through. So they give you aggregate information when you use ROM agents such as this. And the total page view that I’ve got highlighted up there is a key example. Being able to see the total views of a particular page and subpages as well is vital when you’re looking at adoption. Not just cuz you want to see if there’s a general upward trajectory, but also if you want to see if there’s patterns for perhaps planning for capacity.
Carly Richmond: We know that there’s particular times that might be especially busy. So for example, black Friday for e-commerce is a big one, but there might be particular spikes or frequencies that you might not know about. For example, maybe they thought they were gonna use this feature monthly and it turns out they’re only using it quarterly. Knowing these kinds of things can help us plan for capacity, plan for support, and maybe asking questions about how the future could be adapted, if there’s something perhaps missing that we need to consider. Sometimes it doesn’t work for one particular user. We’ve all had that joke. It works on my machine movement writing code, right? While I’ve had the situation where it doesn’t work on one particular user’s machine and I’ve not been sure why, but it’s worked for everybody else and they’re all happy and I know they’re using it because I’m getting great feedback and I’m getting a ton of feature requests as well.
Carly Richmond: In this particular case, I actually turned up at this individual user’s desk one day and I wanted to see what they were doing and I found some information I’d struggled to get from chatting over the phone. Firstly they were using Internet Explorer, which the application had not specifically been built to support.
Carly Richmond: And the second thing that was of interest was that they had some custom cookie settings that were enabled which had to be cleared out and then ta-da by magic it worked and I was able to tell that through using the Chrome developer tools consult. I could see the stack trace within there. You’re not always gonna be able to do what I did and hop over to your user’s desk. So how do we get this information? Well, rum captures it too. It captures information about the agent that’s accessing the site.
Carly Richmond: As you’ll see here, I can see a visitor breakdown in the first pie chart there, which is each of the individual browsers that are using this particular site. And then I can also see the operating systems as well. Now some people might still in particular domains such as healthcare still need to support Internet Explorer, but even in the future there might be browsers that are dying off that are being decommissioned that you’d need to consider if you need to warn your users off using it or provide support for that browser. Furthermore, if you’re not using a mobile first development strategy, you might want to see what different operating systems and devices are accessing in order to plan, you know, do we need to make a move to mobile development? Do we need to build out that desktop app when we started at mobile? And vice versa?
Carly Richmond: Sometimes those errors are gonna appear. Rather than having to rely on me walking over and seeing the console, just being able to see the occurrences of these particular errors over time, see the stack trace and also the metadata associated with it. You’ll be able to see in the error occurrence, just underneath it does actually see which browser is using this. And then if you want to do smart extensions you’ll be able to see the metadata as well. And the stack trace, this requires uploading of the source maps because obviously for production code you’ll be using JavaScript and this source maps allow you to kind of reverse engineer to see the traces. But obviously this information is vital as well so that you’re able to basically see what’s happening remotely without having to necessarily dig around in the console on a user’s computer.
Sukrutha Bhadouria: We need to wrap <laugh>. Sorry about that.
Carly Richmond: Yeah, no worries. The last thing is sometimes they might not be U, they might think they’re not using it, but they are. I know that sounds a bit strange, but particularly if you’re working for large institutions that are trying to reduce their footprint decommission legacy software, you’ll probably need to know if it is indeed being used and get assurances before you switched it off. And I’ve had this situation before where despite assurances I’ve found that it is indeed being used on bank holidays in one country and that would’ve been really difficult to find had it not been from looking through the network logs.
Carly Richmond: However, if you make use of these controls in a way that you might not expect, you can answer these information, answer these questions. Taking a look at page mode by duration, by region actually gives you not just the idea of seeing where low bandwidth items are, but bandwidth countries are. But you’re also able now to see as well where in the world it’s being used.
Carly Richmond: With all monitoring, of course, I have to put the useful responsive reasonable responsibility disclaimer app, make sure you use these metrics responsibly. They are not meant to be for spying on your users. They’re meant to be for improving your application. Use them with that ethos in mind. And thank you very much for your time everyone.
Sukrutha Bhadouria: Thank you so much. This was wonderful. Bye everyone.
Carly Richmond:Bye.
Like what you see here? Our mission-aligned Girl Geek X partners are hiring!
- Check out open jobs at our trusted partner companies.
- Watch all ELEVATE 2023 conference video replays!
- Does your company want to sponsor a Girl Geek Dinner? Talk to us!
